School libraries in Aotearoa New Zealand — 2022
Read the report on the 2022 national survey of school libraries in Aotearoa New Zealand. Find out about library staff employment, support and professional development. See our findings about school library collection sizes, format trends and funding.
Executive summary
Background
This is the fourth report from an ongoing series of national surveys of school libraries in Aotearoa New Zealand that started in 2018. The surveys are a collaboration between the National Library of New Zealand Services to Schools, the School Library Association of New Zealand Aotearoa (SLANZA) and the Library and Information Association of New Zealand Aotearoa (LIANZA).
The information gathered through these surveys helps us establish a common understanding with stakeholders about:
the current makeup of the school library workforce
expected changes in the school library workforce
trends in school library collections and resources
school investment in library collection development
the impact of the COVID-19 pandemic on school libraries.
Summary of findings
Library staff employment arrangements
Our findings show differences in employment arrangements for responding schools, across school types.
Primary and composite school paid library staff hours are very similar to 2021 levels but have dropped at responding intermediate and secondary schools.
As student year levels increase, the percentage of library staff working part-time decreases.
More intermediate school library staff work part-time than full-time, in one school library. This is a reversal of the 2021 findings.
About 25% of primary school library staff work in more than one part-time position.
Most school library staff work during term time only (40 weeks per year).
74% of respondents think it is unlikely their hours will reduce, a drop from 80% in 2021.
28% of school library staff said their skills are a good match for the requirements of their current role. 69% said their skills are higher.
20% of school library staff feel their pay is appropriate for their role and responsibilities. 66% feel it is not, up from 55% in 2021.
71% of school library staff said they enjoy working in the school library and 64% say they'd like to continue in the role. These figures are both significantly lower than 2021 responses. 16% said they plan to retire in the next few years, and 9% were actively seeking other work.
Most comments in this section said their role and the library are valued by senior leadership.
Those who said it was likely their hours would reduce gave budget pressures and changes in school leadership as the main reasons.
School library staff respondents' qualifications are varied. They include certificates and diplomas, degrees and post-graduate qualifications in Library and Information Studies (LIS) and other fields. Qualification levels vary across school types, with primary school library staff most likely to hold no qualifications.
Support and professional learning
58% of school library staff respondents said that they are supported well by their school's leadership team, but 20% said they are not.
We presented 22 options for continuing professional development and asked respondents how often they use each one. Findings are similar to the 2021 survey, with the 10 most popular options being:
National Library Services to Schools' website, network meetings, face-to-face learning events, webinars and online meetings
the SLANZA website
online learning courses (not provided by National Library or SLANZA)
social media and blogs, the school library listserv, peer-to-peer support
school-wide professional development.
Library collection holdings and trends
We asked respondents to tell us about their collection holdings across 3 broad categories — print resources, digital resources and physical items. Findings are again similar to the 2021 survey.
For all responding schools, the bulk of current holdings is print items. Responding secondary schools are more likely than other schools to include digital resources in their collections. Physical items are most likely to include:
mobile devices such as laptops that students can borrow, particularly in secondary schools
puzzles and games, craft supplies and materials.
Mobile devices, artefacts and objects, or maker tools and equipment make up less than 1% of responding schools' collection holdings.
Respondents showed the least uncertainty in responses about the future of print formats. Within the print category, respondents expect all format types to grow — slightly for magazines and print non-fiction, and significantly for graphic novels, comics and manga.
Respondents are less sure about holdings of digital resources. Respondents expect holdings of freely available digital content to grow. eBook and audiobook holdings are expected to remain static and DVD holdings to decline significantly.
Collection development budgets
Across all responding schools, the 2022 median budget was $8.46 per student. This is $3.02 per student less than the median for all schools in 2021.
Mean per-student budgets at responding primary and secondary schools rose slightly from 2021 but dropped for intermediate and composite schools.
There is still some variation between school types, although the funding gap between the highest and lowest budgets (per student) remains at $3.99, the same as in 2021.
Most respondents (64%) said their 2022 collection development funding was the same as the previous year.
Using this report
It is up to each school and kura to decide the levels of library staffing, funding and other resourcing they need to achieve the goals and aspirations they have for all their learners.
We hope that this report can help guide schools in making those decisions. The findings in the report are best used alongside the other school library development resources and support National Library, SLANZA and LIANZA provide.
We recommend that National Library Services to Schools, LIANZA and SLANZA:
share the findings with stakeholders, especially in the education and library sectors
use the findings to guide the development of our services that support school libraries and school library staff
encourage further research stemming from the findings of this survey
work together to address concerns raised in this report about school library provision
survey schools again to track changes over time and to deepen our understanding of areas identified for particular focus.
Introduction
Purpose and scope
This is the fourth report from an ongoing series of national surveys of school libraries in Aotearoa New Zealand that started in 2018.
The surveys are a collaboration between the National Library of New Zealand Services to Schools, the School Library Association of New Zealand Aotearoa (SLANZA) and the Library and Information Association of New Zealand Aotearoa (LIANZA).
Through these surveys, we aim to add to our existing evidence base about the nature of school libraries in New Zealand. The surveys help inform our organisations as we prioritise, plan, and deliver services to school libraries.
The information gathered through the surveys helps us establish a common understanding with stakeholders about:
the current makeup of the school library workforce
expected changes in the school library workforce
trends relating to school library collections and resources
school investment in library collection development
the impact of the COVID-19 pandemic on school libraries.
The 2022 survey builds on information gathered in 2018, 2019 and 2021. We did not conduct a survey in 2020.
Survey design and implementation
Across the 4 surveys, we have included questions about:
school library environments — including physical and digital access
school library services supporting teaching and learning, reading and student wellbeing
the school library workforce — including current employment arrangements and future work plans, skills and pay, qualifications, professional memberships, support and involvement in continuing professional development
collection holdings, collection development budgets and sources of funding.
The 2021 survey asked respondents to describe the impact of the COVID-19 pandemic on:
library staff hours
collection development funding
collection holdings
library services.
In the 2022 survey, we added new questions for school library staff about their:
pay grades, years of school library experience, and involvement in co- and extra-curricular groups within the school
study plans and awareness of financial support for tertiary study.
Survey implementation
The 2022 survey link was shared with schools through:
the New Zealand school library email listserv
National Library’s Services to Schools newsletter
school network contact lists and social media.
SLANZA and LIANZA also shared the link with their members.
Responses were collected between 2 and 29 November 2022.
Sample size, questions and demographics
We received 393 responses to the 2022 survey. We excluded 76 responses, which were either incomplete, duplicates or responses where the school was not uniquely identifiable.
This left a core sample size of 322, representing approximately 12.8% of New Zealand schools. This is a lower response rate than previous surveys which ranged from 14% to 20%.
Questions
266 respondents, who were school library team members and employed as support staff, were asked about their employment and support.
All survey questions were optional apart from those asking about school type and respondent's role. This means that the number of responses varies from one question to another. The percentages shown in our findings are calculated on the number of responses to specific questions.
Demographics
The Auckland and Wellington regions are over-represented in the responses. All other regions align closely with school demographics.
Secondary schools are over-represented in the survey responses. They make up 48% of responses but only comprise 14% of schools. Primary schools are under-represented to a similar degree.
Ideally, we'd have 10% of respondents from each decile to ensure a balanced data sample. However, in the survey responses:
decile 1–3 schools are under-represented, totalling only 16% of responses
decile 10 schools are over-represented, totalling 21% of responses.
Respondent characteristics
83% of respondents were school library staff (library assistants, librarians, library managers and teacher-librarians).
41% of school library support staff work extra roles (often teaching assistants/learning support or administration/office support positions). Most who chose ‘other’ as their role are assistant or deputy principals.
Table 1: Respondent roles
Role(s) | School library staff | Teacher librarian | Other support staff | Teacher | Principal | Other |
|---|---|---|---|---|---|---|
Main role | 266 | 13 | 15 | 9 | 6 | 13 |
Employed in any additional role(s) | 108 | 5 | 14 | 5 | 2 | 7 |
Analysis and reporting
In this report, we discuss the main findings from each section of the survey. Data are generally presented as aggregated totals. Where data show a clear difference between school types (as listed in Table 2 below), we provide a more detailed breakdown.
Table 2: Year levels for New Zealand school types
School type | Year levels |
|---|---|
Contributing (primary) | 1–6 |
Full primary | 1–8 |
Intermediate | 7–8 |
Secondary | Within the range 7–13+ |
Composite | 1–13+ |
Themes and more information
We have coded the free-text responses to summarize the main themes that emerge.
We may be able to provide individual schools or organisations with a more detailed analysis on request, for example, based on school size, region or isolation factor.
Library staffing and employment
We presented a range of volunteer and paid roles and asked respondents to select which of these roles work in their library. There were 314 responses to this question.
Only 4 chose ‘none of these roles’. For all of the other roles that respondents selected, we asked how many hours of work each role has per week.
We asked school library support staff 2 extra questions about their hours:
the likelihood their hours would reduce in the next 12 months
what changes they'd make to their hours, if possible.
Roles and hours
Across all responding schools, 75% use student volunteers. Their contribution averages 10 hours of work per week.
Responding primary schools are more likely to have a ‘teacher with library responsibility’ role than other school types.
314 unique schools provided information about hours of work. Responses show that as school rolls and student year levels increase, so do paid library staff hours.
Paid library staff hours for responding primary and composite schools have increased by approximately 5% from the 2021 figures. Responding intermediate and secondary schools report a drop in paid library staff hours by 15% and 11% respectively.
Table 3: Responding schools’ average roll and staff/volunteer hours
School type | Average roll | Average paid hours per week | Average volunteer hours per week |
|---|---|---|---|
Contributing and full primary | 391 | 18 | 12 |
Intermediate | 688 | 28 | 19 |
Secondary | 964 | 42 | 17 |
Composite | 638 | 48 | 16 |
The likelihood of hours reducing
We asked school library staff if they thought their hours would reduce in the next 12 months. There were 218 responses to this question. 74% of responses said it's unlikely or very unlikely. This is a reduction from the 2021 survey where 80% of respondents said it was unlikely or very unlikely their hours would be reduced.
Respondents who commented on the likelihood of hours reducing mentioned these reasons in their comments:
tight budgets, including the increased costs of funding support staff
changes in school leadership and uncertainty about hours as a consequence
library staff retirements seen as an opportunity to reduce hours
lack of support for the library within the school.
Some comments
School wants to save money, roles are being made redundant post pay-equity, support staff roles and library don't seem to be valued as highly.
Money is openly talked about as being tight and we will be appointing a new principal this term.
I am retiring this year and I think there is a high chance that they will try to employ a new person (not necessarily a qualified or experienced librarian) for fewer hours to reduce pressure on budget or allow for spending in other areas. I also think there is a huge concern within management around the perceived extra cost that a pay-equity settlement may bring.
Preferred changes to hours
181 respondents commented about preferred changes to their hours.
77 said they do not see a need for their hours to change. Another 77 said they'd like longer paid hours, either for themselves personally or for library staffing overall.
The main reasons respondents gave for wanting longer hours are similar to the 2021 survey. Reasons noted fall into these main themes:
providing non-contact time for library administration and management — before and after school and outside term time
providing greater benefits for teaching and learning
reducing the amount of unpaid work that library staff do in their own time
funding additional staff hours to manage the workload.
Some comments
I'd like to be able to work remotely (e.g. from home, I could complete various tasks: create/update library policies, review materials before making purchasing decisions, attend virtual meetings, etc).
I would like to be paid for some of the hours extra that I do. Although I am paid 35 hours per week, I work at least 2 hours extra a day, plus no lunch break.
I would like to work more than the 40 weeks a year. This would enable me to do more planning/cataloguing/displays etc outside of class hours and spend more time educating and sharing a love of reading with visiting classes/staff.
I know how very fortunate I am to have the hours I do for such a small school but it helps that our school library is central to many activities at school.
I would like to be paid to work during the school holidays. There is always more work that needs doing and I would then not have to struggle through that holiday period to cover my living expenses.
Employment arrangements
Part-time versus full-time
There are clear differences in respondents' employment arrangements across school types. 258 respondents answered the question about part-time and full-time work.
80% of primary school staff respondents work part-time. 56% work in just one school library. 24% work in more than one position.
65% of secondary school staff respondents work full-time in just one library. A further 31% work part-time in one library. 4% work in more than one position.
50% of composite school library staff respondents work full-time in one school library.
These findings above are similar to previous years. However, in 2022 responding intermediate schools reported more library staff working part-time than full-time, in just one school library — a reversal of 2021 findings.
Table 4: School library staff part-time and full-time employment
School type | Part-time in just one library (%) | Part-time in more than one position in the school (%) | Part-time in more than one library (%) | Full-time in just one library (%) |
|---|---|---|---|---|
Contributing and full primary schools | 56 | 17 | 7 | 20 |
Intermediate schools | 57 | 14 | n/a | 29 |
Secondary schools | 28 | 3 | 4 | 65 |
Composite schools | 33 | 17 | n/a | 50 |
Term-time or full year
244 school library staff answered the question about working term-time only (40 weeks) or for the full year (52 weeks).
214 said they work during school term time only. Library staff in composite schools are more likely to work 52 weeks per year than staff in other school types.
Table 5: School library staff employed term-time only
School type | Employed term-time only (%) |
|---|---|
Contributing and full primary schools | 92 |
Intermediate schools | 93 |
Secondary schools | 85 |
Composite schools | 79 |
Years of experience in school libraries
We asked library staff how many years they’ve been employed in their current role. We also asked them how many years in total they've worked in school library roles.
25% of respondents have been in their current role for one year or less, with a further 27% between 2 and 5 years.
30% of respondents have worked a total of 5 years or fewer in school library roles. 20% of respondents have more than 20 years total experience working in school libraries.
This level of staff turnover is consistent with findings from the 2021 survey where 31% of respondents said they were either actively looking for other work or planning to retire.
Skills and pay
We asked library staff to compare both their skills and pay with the requirements and responsibilities of their current role. 312 respondents answered these questions.
Across every school type, significantly more 2022 respondents feel their skills are higher than what their job requires compared with the 2021 survey.
28% said their skills are just right for their current role. Of the remainder:
33% said their skills are a bit higher — and 36% said much higher — than what the job requires
only 3% said that their skills are lower than what's needed in their current role.
20% agree that they are paid appropriately. 66% of respondents feel that they are not paid appropriately considering their role and responsibilities, up from 55% of respondents in 2021.
The timing of the survey and pay equity settlements for other school support staff may be a factor in these results.
Comments about skills and pay
110 respondents commented on their pay.
Only 13 were satisfied with it. There were many comments about pay generally, and specifically the relationship between skills and remuneration. The comments fall into 3 broad themes:
pay grades and rates are too low, given the responsibilities inherent in the role
pay rates do not recognise the individual's skills, qualifications or experience
disparity with other support staff while the Librarians and Library Assistants' Pay Equity Claim is not settled.
Some comments
I realise quite a number of school librarians do not have library qualifications, but the responsibilities in respect of supporting and supplementing the teaching programmes are considerable. School librarians do a lot of teaching as part of their jobs.
Skills needed in a modern library are not well understood by teaching staff and management. We don't just put books away.
School libraries and school librarians continue to be undervalued. We need the pay equity negotiations to happen as soon as possible to address this going forward.
I worry that volunteers can be too heavily relied on to do work that should be done by paid, qualified staff. There is reasonable argument for student librarians to be trained up, and so getting help from them is great, but asking for parent volunteers I feel is a slippery slope into totally devaluing library work (and having it not done well).
Charts and tables about skills and pay
Figure 1: School library staff skills compared to skills needed in their role
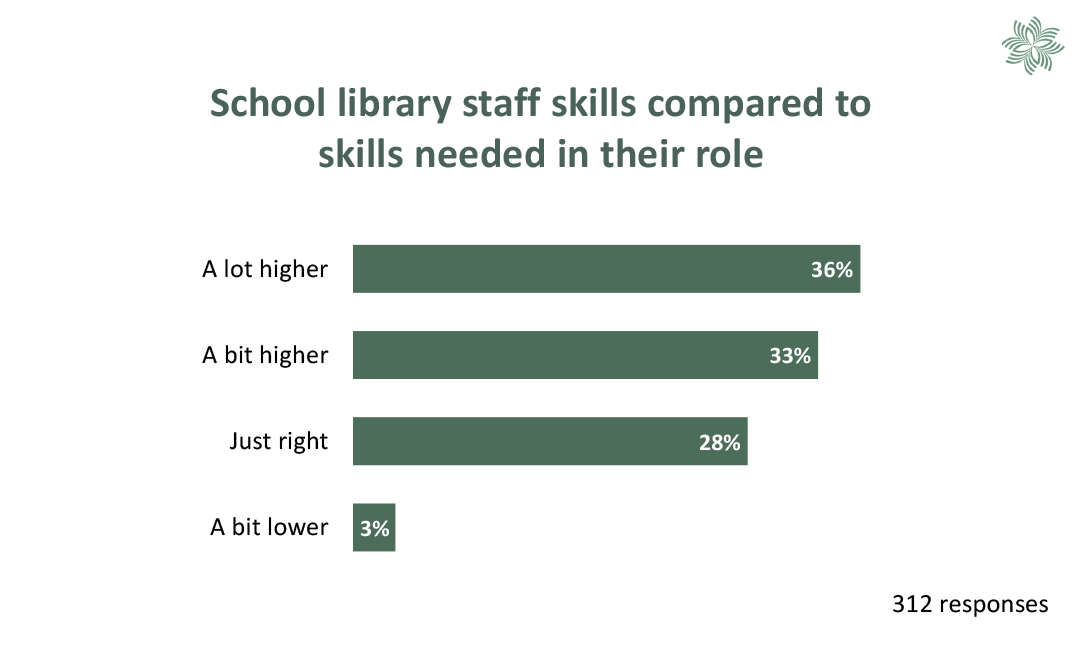
Table 6: School library staff skills for their role — breakdown by school type
School type | Higher (%) | Just right (%) | Lower (%) |
|---|---|---|---|
Contributing and full primary | 70 | 28 | 2 |
Intermediate | 80 | 13 | 7 |
Secondary | 69 | 27 | 3 |
Composite | 48 | 47 | 5 |
Figure 2: School library staff pay is appropriate for role and responsibilities
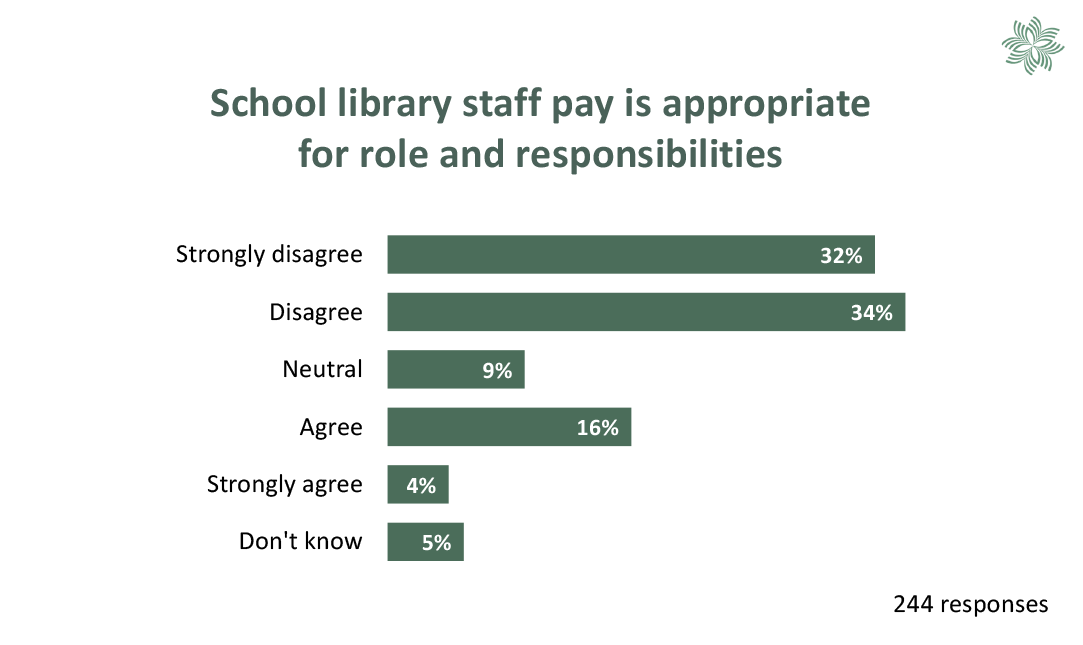
Table 7: School library staff pay is appropriate for role and responsibilities — break down by school type
School type | Agree (%) | Neutral (%) | Disagree (%) | Don't know (%) |
|---|---|---|---|---|
Contributing and full primary | 24 | 9 | 62 | 5 |
Intermediate | 31 | 7 | 62 | n/a |
Secondary | 15 | 9 | 71 | 5 |
Composite | 28 | 17 | 55 | n/a |
Pay grades or remuneration arrangements
We asked library staff to indicate their job grading or remuneration arrangements. 238 library staff responded to this question.
49 are employed in private or state-integrated schools. They are more likely to be employed under an individual employment agreement than other school staff.
The remaining 189 respondents are employed under the Support Staff in Schools Collective Agreement, most commonly within Grade C of the agreement.
At the time of writing, the Librarians and Library Assistants' Pay Equity Claim has reached settlement. Pay rates for these staff will rise, effective 23 November 2022, with settlement to be back paid by the end of August 2023.
Table 8: School library staff remuneration and grading — all schools by school type
School type | Grade A (%) | Grade B (%) | Grade C (%) | Grade D (%) | Other arrangement (%) |
|---|---|---|---|---|---|
Contributing | 4 | 27 | 53 | 11 | 5 |
Full primary | 3 | 18 | 47 | 8 | 24 |
Intermediate | n/a | 15 | 54 | 23 | 8 |
Secondary | 1 | 5 | 58 | 27 | 9 |
Composite | n/a | 17 | 44 | 6 | 33 |
Some comments about remuneration
It recently occurred to me that if I were the sole earner in our family, I couldn’t support our family on my wage.
I'm barely paid minimum wage when it is annualised. And I work as hard as any teacher, why shouldn't I also get paid for the holidays. It's patently unfair.
I am okay with my current rate but happy to know that it is being reviewed through the pay equity claim.
I am responsible for two staff and my pay does not reflect that. Now paid significantly less than admin staff with no staff responsibility.
My remuneration is at the top of the existing award which I appreciate but outside of the education sector, my skills would earn better money.
I do a lot of unpaid work but know the school can't afford extra hours for me. I do feel valued and appreciated otherwise though.
Being underpaid for many years has come with the role. However, passion for students, their reading and information requirements have kept me working here, but it is wearing thin. I feel undervalued. It is quite demoralising being one of the lowest paid staff members. It is increasingly difficult to do the job with the same passion as I once did when feeling so undervalued.
My hourly rate is reasonable, it's the just being paid for 40 weeks of the year that makes it financially a very lowly paid job and not tenable unless you have another source of income.
Factors influencing employment decisions
We presented a variety of factors and asked library staff to indicate which ones influence their decisions about current and future work. 312 respondents answered these questions.
Percentages will add to more than 100 because respondents could select more than one factor.
Current employment
Analysis of factors that influence respondents' current employment decisions showed the following:
71% of respondents said they enjoy working in the school library, down from 94% in 2021.
59% indicated that hours aligning with their needs is a factor (bear in mind most of the respondents work term-time only).
46% said they live in the local area.
44% expressed an interest in working with young people.
24% said their children attend or used to attend, the school where they work.
Comments about current employment
Respondents could include comments to give reasons for their choices. Respondents made 53 comments, with these main themes:
77% of respondents' comments mentioned enjoyment of the job.
26% made specific mention of sharing their passion for books, reading, literacy and learning.
11% mentioned having autonomy and variety in the job.
Some comments
I am leaving my employment here … because I hate being on my own, I miss being in a team, and I miss being developed professionally by someone who pays attention and understands what I need for my growth and development, as well as what I can offer the school. I don't feel valued or included at the school.
I believe passionately that helping kids enjoy reading is really, really important for their future success. Plus — I just love the magic of books!
My children are all adults now so no excuse in terms of parenting responsibility, but this is my happy place, I love working with children, working in education and fostering a love of reading, inquiry and curiosity. Plus, we have a wonderful staff team.
The school library is highly thought of within the school community including management. It is well supported with good purchasing budgets.
Future plans
Analysis of factors that influence respondents' future employment plans showed the following:
64% of respondents said they'd like to continue working in their current school library role, down from 80% in 2021.
23% said they would consider other library work involving services for children or youth.
13% would consider other library work not involving children or youth.
9% are currently looking for work outside of libraries.
16% of respondents said they plan to retire in the next few years.
Comments about future plans
Respondents could include comments to clarify their reasons for their choices. Respondents made 127 comments, with these main themes:
36% of respondents' comments described the lack of income or earning potential as the main factor influencing their decisions about future employment.
20% of commenters mentioned changes in their personal circumstances that would affect future decisions. An example mentioned was their own school-age children becoming increasingly independent which allowed for longer work hours.
17% of commenters gave their age and nearing retirement as deciding factors.
Some comments
My ‘career’ has stopped at this point as I cannot go any higher within my school. I don't see me progressing much higher and this also influences my training decisions.
Love my job! But I do feel it is a shame that the library and library positions are at the whim of the current management and board desires. Not having a mandatory MOE requirement for a library in a school is a huge disadvantage and there seems to be an enormous amount of pressure put on schools to repurpose library space for use as classrooms throughout the country. This leads to a fear of instability of employment which is distressing and worrying.
I am open to moving to a school library role closer to my home, but I prefer a team around me (even 1 other person) and not to be sole charge or the team manager at this stage of my career. I have also considered other library roles, but they are often full-time, and I really like the school holidays to spend time with family or travel.
Currently just gaining a little bit of staff management, budget management, strategic direction-setting experience in this school role before trying to move to management in a public library system. Should be gone from schools in a few years. I love managing a school library, but it's a dead-end career wise.
It would be good to have ring-fenced funding and a permanent job. My contract is 12-month only and renewed each year which doesn't give 100% certainty of employment. For the amount of energy and time I put into this role I think this is very unfair as I believe my role is closely aligned with that of a teacher.
For several years, I have been looking to work at schools closer to where I live. However, it seems that librarian positions in primary schools are relatively rare. Positions that I have applied for I have not even been interviewed for despite being well qualified and experienced. Subsequently, I have discovered that the position has gone to a parent of children at the school with no experience or qualifications. This indicates to me that some principals do not seriously value their libraries or esteem the library profession.
Library staff involvement in curriculum and extra-curricular groups
We asked library staff to tell us about the curriculum and extra-curricular groups or teams they are part of in their school. 219 respondents completed these questions.
51% said they are not involved in any such groups or teams. Of the remaining respondents, half belong to their school’s literacy team or group.
Other groups that library staff belong to include PB4L (Positive Behaviour for Learning), health and safety, and a mixture of sports and cultural groups.
Table 9: Library staff involvement in curriculum and extra-curricular groups
Literacy (%) | Inquiry (%) | Information literacy (%) | eLearning (%) | ESOL (%) | Student mentoring (%) | Home-school partnerships (%) |
|---|---|---|---|---|---|---|
50 | 23 | 31 | 8 | 7 | 15 | 4 |
Staff qualifications
We asked school library staff to tell us about the qualifications they hold. 312 respondents answered the questions in this section.
The responses show that school library staff have a wide range of qualifications.
27% hold a sub-degree level Certificate or Diploma in Library and Information Studies (LIS).
25% of respondents hold more than one qualification.
11% of respondents say they have no qualifications.
Table 10: School library staff with no qualifications
School type | Number of responses | No qualifications (%) |
|---|---|---|
Contributing | 65 | 17 |
Full primary | 61 | 8 |
Intermediate | 15 | 13 |
Secondary | 150 | 11 |
Composite | 21 | 5 |
Table 11: School library staff with qualifications in library and information studies (LIS)
School type | Sub-degree level certificate or diploma (%) | Degree (%) | Post-graduate qualification (%) |
|---|---|---|---|
Contributing | 25 | 3 | 2 |
Full primary | 26 | 5 | 5 |
Intermediate | 27 | 7 | 33 |
Secondary | 27 | 8 | 14 |
Composite | 33 | 0 | 19 |
Table 12: School library staff with qualifications in other subject areas (not LIS)
School type | Sub-degree level certificate or diploma (%) | Degree (%) | Post-graduate qualification (%) |
|---|---|---|---|
Contributing | 17 | 22 | 8 |
Full Primary | 15 | 23 | 15 |
Intermediate | 7 | 40 | 0 |
Secondary | 7 | 39 | 19 |
Composite | 14 | 43 | 10 |
Study plans
We asked school library staff about their current and future plans for undertaking library studies.
3% of respondents were currently undertaking study, with 17% considering studying towards a library and information qualification.
Almost half the respondents said they were aware of SLANZA's and LIANZA’s range of financial support for study (47%) and tertiary grants funding (48%).
Comments about study plans
Respondents could provide comments about qualifications, registration or professional memberships. The main themes of the 46 comments received were:
positive experiences with study and professional groups, including SLANZA and LIANZA (17 comments)
the costs — in money and time — of studying or registration outweigh the benefits (16 comments)
availability of financial support for study — for example, from school or study grants — is valued (8 comments).
Professional memberships
We asked school library staff what professional memberships they currently held. Of the 312 respondents:
2 are members of Te Rōpū Whakahau
35 are members of LIANZA
203 are members of SLANZA.
Support and continuing professional development
Support from the leadership team
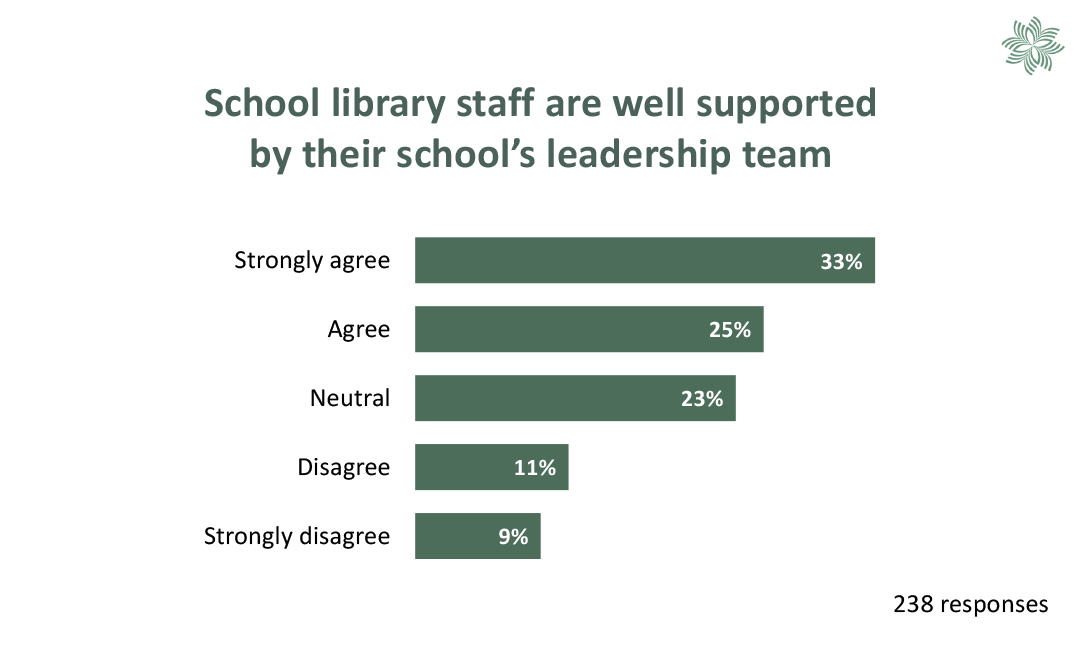
We asked school library staff about leadership team support for their role. 238 respondents answered this question.
58% of respondents agree that they are well supported by their leadership team, but 20% said they are not.
Figure 3: School library staff are well supported by their school's leadership team
Comments about support from the leadership team
Respondents could add comments about support for their role. Many comments were from respondents who felt supported by their school and the wider community, including the National Library and SLANZA.
From the comments about limited support or lack of support, these main themes emerged:
library staff are trusted to work independently and can be self-sufficient, but support is available if needed
there is a perceived lack of understanding of the role or importance of the library, which translates into low use of, and support for, the library
support is provided by some, but not all, staff.
Some comments
I am excluded and I have been told the library has nothing to do with literacy.
I am not supported a lot at all, and the library is thought of as a last resort for any funding so much so the last 3 years there has been no funding. This year we got $1000 and a grant but not enough for a school of our size. No one realises the amount of work that goes into running a library and think all I do is issue and return and shelve books. It is very disappointing they don't want to support their children in reading for pleasure.
I feel frustrated that I am not able to use my skills much in this work environment. No matter how hard I try to make inroads with staff for them to make use of the skills and knowledge I am able to share, I get ignored or they are just not interested in the resources or services we are able to give them.
Table 13: School library staff are well supported by their school's leadership team
School library staff are well supported | Respondents who agree or disagree (%) |
|---|---|
Strongly agree | 33 |
Agree | 25 |
Neutral | 23 |
Disagree | 11 |
Strongly disagree | 9 |
Continuing professional development
We showed respondents a range of learning options and asked how often they use each one.
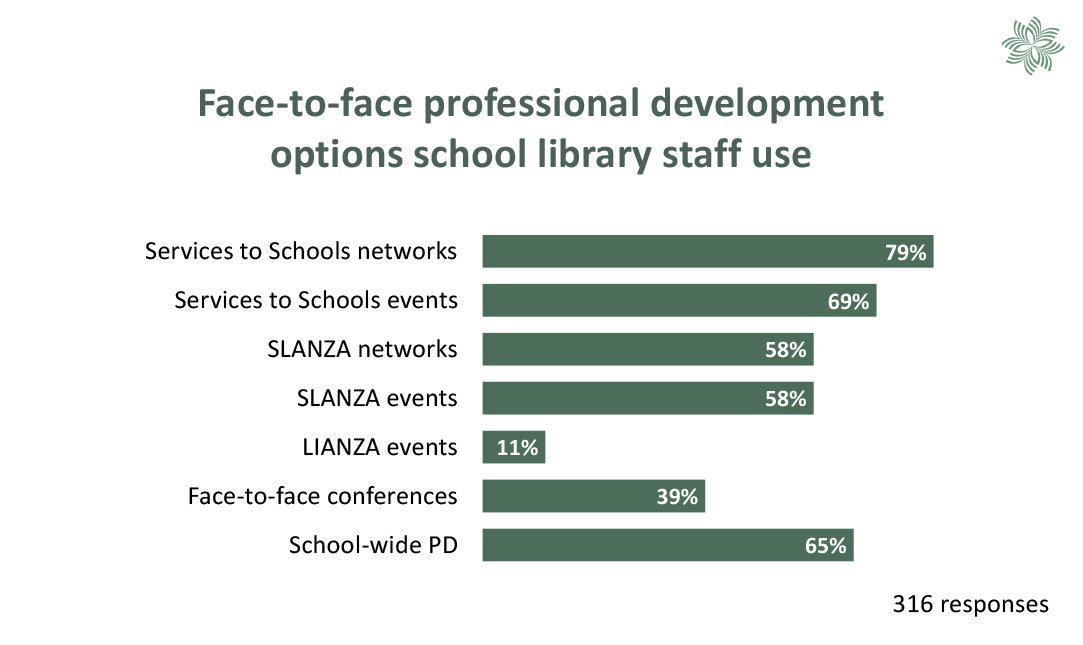
Face-to-face professional development options included:
school-wide professional development (not library-specific)
local network meetings, learning events and workshops offered by the National Library, LIANZA or SLANZA
in-person conferences.
These options showed the most variation in uptake, as shown in figure 4 below. The most-used option is network meetings facilitated by National Library Services to Schools.
Figure 4: Face-to-face professional development options school library staff use
Other learning options presented included:
participating in online learning such as courses, webinars, and meetings
reading online sources of information including websites, blogs, or journals
participating in informal, social options such as peer support, email lists and social media.
Table 14: Professional development options used sometimes or often
Continuing professional development options | Use sometimes or often (%) |
|---|---|
School-wide professional development | 65 |
Services to Schools networks | 79 |
SLANZA networks | 58 |
Services to Schools events | 69 |
SLANZA events | 58 |
LIANZA events | 11 |
Face-to-face conferences | 39 |
Services to Schools online courses | 63 |
SLANZA online courses | 54 |
Services to Schools webinars and online meetings | 69 |
SLANZA webinars and online meetings | 54 |
LIANZA webinars and online meetings | 16 |
Services to Schools website | 94 |
SLANZA website | 73 |
LIANZA website | 24 |
Professional journals | 56 |
School library blogs | 80 |
Peer-to-peer support — school librarians | 79 |
Peer-to-peer support — public librarians | 50 |
School library listserv | 82 |
Other listservs | 29 |
Social media | 59 |
Collection holdings
We asked respondents questions about 3 broad categories of items:
print resources, including fiction and non-fiction texts and graphic formats
digital resources, including eBooks and eAudiobooks and links to free or paid content
physical items including mobile devices, objects and artefacts, tools and other equipment.
We also asked respondents to tell us how they expected their holdings of each format or item type to change.
Size of collection
We asked respondents to give the total number of items in their collection. They could also provide a breakdown of the number of items held for specific formats or types. Many schools provided both the total size and a breakdown by format and type.
It's important to note that collection sizes and school rolls vary widely within each school type. In this section, we have used median data to avoid the skewing effect of outlier (extremely high and low) responses.
Table 15: Responding schools’ median roll and collection items per student
School type | Median school roll | Collection items per student |
|---|---|---|
Contributing | 398 | 18 |
Full primary | 410 | 15 |
Intermediate | 561 | 13 |
Secondary | 748 | 14 |
Composite | 299 | 21 |
Comments about size of collection
Respondents were able to comment on the size of their current collection. From the 69 respondents’ comments, the main points noted were as follows:
17% said the size of the collection was adequate or appropriate for their school roll.
17% said the collection needs weeding.
16% noted that the types and formats of resources in their collection are changing. For example, they have fewer non-fiction books and more graphic novels.
limited physical space for storage and limited budgets for purchasing can constrain collection holdings.
Formats in the collection
We asked about holdings of different format types. There were 213 responses to these questions.
For all responding schools, print resources still dominate their current collection holdings. Secondary school libraries are more likely to have digital resources. Their collections also contain the highest proportion of digital resources.
Format holdings within our 3 broad categories (print, digital and physical as explained above) vary between school types. For example, picture books make up more than 20% of responding primary schools’ collections. This drops to:
13% for composite schools (years 1–13)
6% for intermediate
1% for secondary schools.
Graphic novels remain a small part of library collections — 6% or less of holdings for all school types.
Responding secondary schools reported digital items make up 26% of their collection holdings. For all other school types, reported digital holdings were either negligible (<1.5%) or the number of responses was too low to provide meaningful analysis (fewer than 5 responding schools).
Table 16: Print holdings by format as a percentage of total holdings
School type | Novels or chapter books (%) | Picture books (%) | Non-fiction (%) | Graphic novels, comics, or manga (%) | Magazines (%) |
|---|---|---|---|---|---|
Contributing | 36 | 24 | 33 | 4 | 1 |
Full | 43 | 21 | 31 | 3 | 1 |
Intermediate | 47 | 6 | 40 | 6 | 1 |
Secondary | 33 | 1 | 35 | 4 | 1 |
Composite | 41 | 16 | 40 | 2 | 1 |
Table 17: Secondary schools’ digital resource holdings by format as a percentage of total holdings
School type | eBook fiction (%) | eBook non-fiction (%) | eAudiobooks (%) | Free digital content (%) | Paid digital content (%) | DVDs (%) |
|---|---|---|---|---|---|---|
Secondary | 15 | 2 | 7 | <1 | 0 | 1 |
Physical items
Respondents' holdings of physical items are almost exclusively mobile devices. The majority of these are Chromebooks or laptops, with fewer small devices such as iPads.
Very few primary school libraries provide mobile devices that students can borrow. As student year levels rise, so does the percentage of schools with mobile devices for loan. The median number of mobile devices managed by responding secondary schools is 38. However, 10 respondents say they manage 200 or more devices.
Comments about physical items
31 comments mentioned other objects, artefacts and tools in respondents' collections.
18 of the comments mentioned puzzles and games.
9 mentioned equipment and materials for creating, including crafts, robotics and 3D printing
4 mentioned audiovisual equipment, such as cameras and headphones.
Table 18: Percentage of responding schools with mobile devices students can borrow
School type and years | Schools with mobile devices (%) |
|---|---|
All primary (years 1–8) | 14 |
Intermediate (years 7–8) | 55 |
Secondary | 57 |
Composite | Insufficient data |
Future changes to collection holdings
We asked respondents how they expect collection holdings of different formats to change. On the left of Figures 5 to 7 below, responses show uncertainty and reductions in holdings. On the right, are responses that show maintenance of current holdings or growth.
Of the broad format categories above, respondents were most certain about print. Holdings of print formats (excluding magazines) have the strongest expected growth. Links to free digital content is the only other format type expecting similar growth.
Holdings of print non-fiction have the highest expected rate of reduction. Other formats expected to reduce are DVDs and print magazines.
Comments about future changes to collection holdings
eCollections are a possibility in the future, but not a priority until the staff will use eResources in class or learn the skills to promote them to students.
Expected more non-fiction New Zealand books with new curriculum changes.
I am steadily growing a cooperative board game collection. This is for library usage and not borrowing at the moment.
Graphic novels is a collection which ākonga are most excited about. I do not expect an increase in the library budget, but money will be moved from non-fiction and fiction to cover the expected increase in spending in this area.
I really hope that the mobile device collection will get smaller but not holding my breath.
I would love to look at lending kits of maker tools, to further supplement our makerspace. I need a funding stream or donations, but it is something I am trying to develop.
I'm going to phase out magazines, there aren't any publications in NZ that the students are interested in. And I could use the shelves.
The web access to material will be a primary focus going forward. It will support classroom learning also as students access curated materials rather than having to sift the whole web.
Charts and tables about future changes to collection holdings
Figure 5: Changes to print holdings
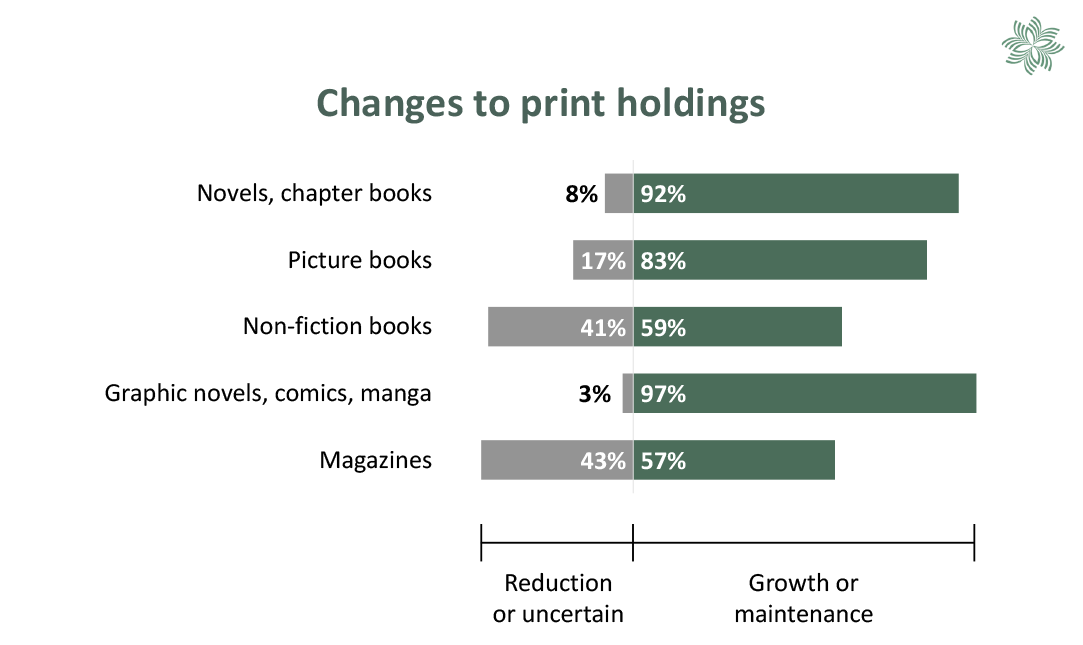
Figure 6: Changes to digital holdings
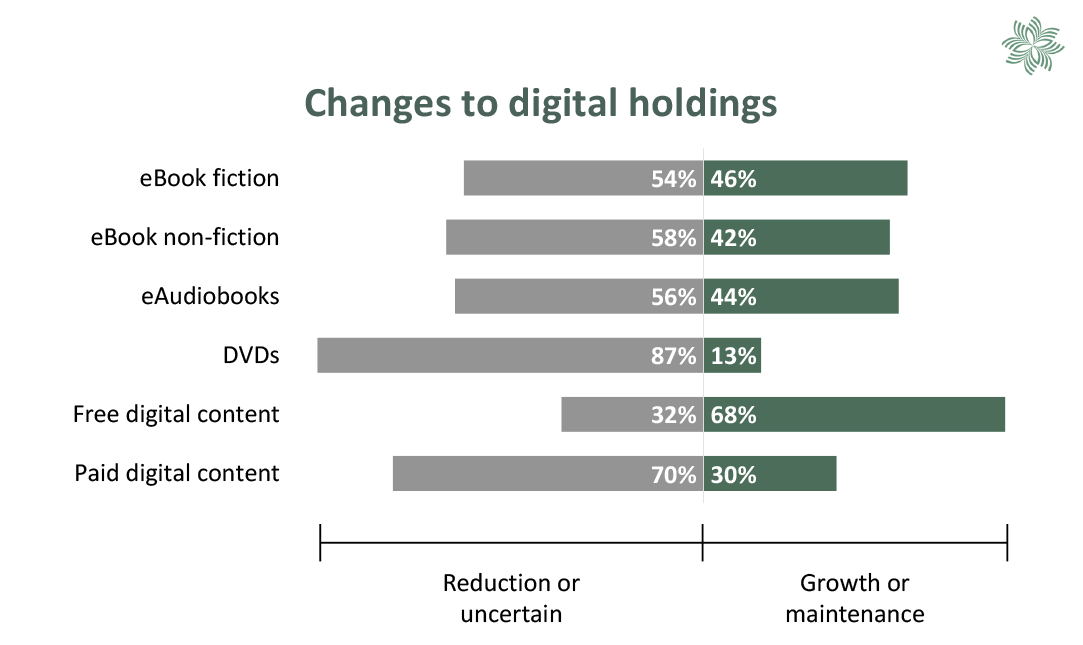
Figure 7: Changes to physical items
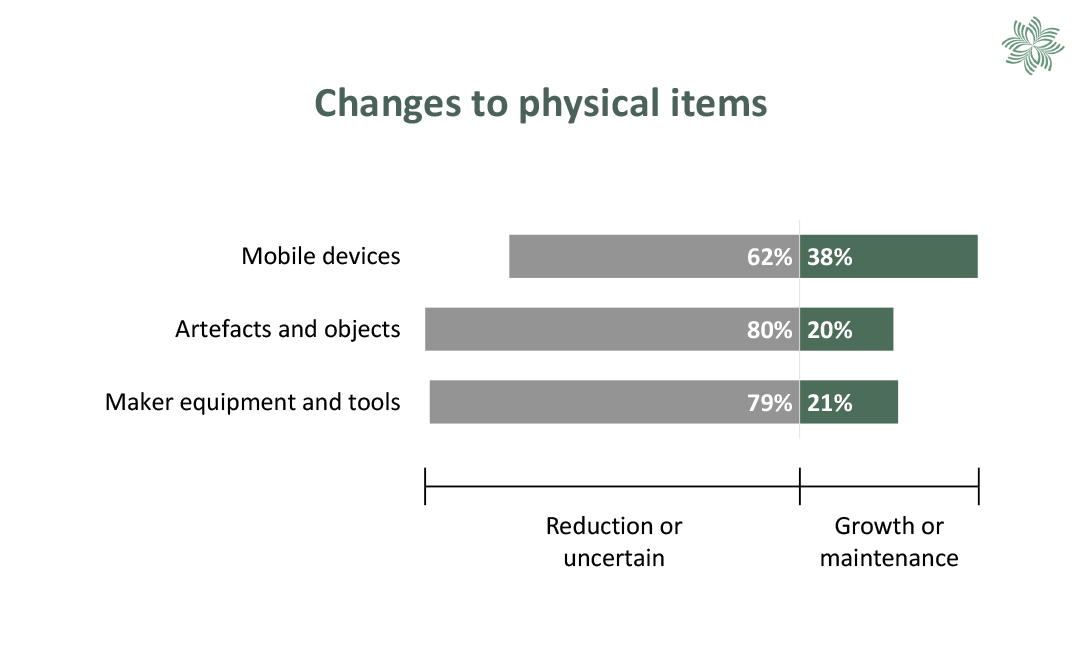
Table 19: Future changes to collection holdings
Format type | Uncertainty or reduction (%) | Maintenance or growth (%) |
|---|---|---|
Novels, chapter books | 8 | 92 |
Picture books | 17 | 83 |
Non-fiction books | 41 | 59 |
Graphic novels, comics, manga | 3 | 97 |
Magazines | 43 | 57 |
eBook fiction | 54 | 46 |
eBook non-fiction | 58 | 42 |
eAudiobooks | 56 | 44 |
DVDs | 87 | 13 |
Free digital content | 32 | 68 |
Paid digital content | 70 | 30 |
Mobile devices | 62 | 38 |
Artefacts and objects | 80 | 20 |
Maker equipment and tools | 79 | 21 |
Collection development funding
Across all responding schools, the median collection development funding in 2022 was $9.38 per student, down from $11.48 in 2021.
Across school types, median budgets per student range from $7.01 to $11.00 and this difference of $3.99 is the same as in 2021.
Figure 7 below shows changes to median per-student budgets since 2018 for each school type.
While primary and secondary school budgets rose in 2022, intermediate and composite school budgets have fallen. For composite schools, this reduction is significant, at $5.13 per student. This change may be a flow-on effect of the COVID-19 pandemic, where private and state-integrated composite schools in particular lost revenue from international fee-paying students.
We asked respondents to compare their 2022 and 2021 budgets.
The majority of respondents say their 2022 funding was the same as 2021 (64%)
23% say they received less funding for collection development
13% say they received more than in 2021.
Comments about funding
We received comments from 74 respondents about collection development funding.
These are the main points to note from their comments:
22 said their budget was adequate, and 13 said it was inadequate.
9 described uncertainty about their current and future funding.
For 8 respondents who commented, it was unclear whether funding was adequate or not.
3 said a lack of time affected their ability to spend the budget and process new resources.
Some comments
My current budget allows for $7.25 per student per year. This budget has not changed for the last 7 years or so. Every year I point out the increasing costs of books versus my low budget. This year I did not ask for more money but advised the finance meeting members of the above and said it was up to them if they were happy with that. There is discussion of an increased budget for next year!
This has not increased in 13 years but our roll and the cost of books have. We used to be able to fill gaps with good-quality donations but this has been steadily decreasing and is now not sustainable as a source of income.
I have had to rely on using rewards from Scholastic Book Club and a book fair for all book purchases for the second year in a row. It has limited what I can purchase as it can only be from Scholastic. There was no other funding.
Macarthy Trust grant works against us as the accountant justifies the minimal budget because the library receives the grant.
So grateful for the Macarthy Trust money. Some years we add with book donation fundraising but not every year.
I do all processing of resources, and only just manage to process all purchases for the year. This is the reason I wouldn't seek more funding for collection development.
In 2021, I had fundraising budget only (bookfair). This year was a Macarthy Trust year, so I am on edge as to what 2023 will look like and whether it will be another zero school funding year (I am yet to be told).
It has stayed consistent for the time I have been librarian — just supplied with no need for me to argue/prove anything. Sometimes I have a hard job spending it as it is only me to process!
Charts and tables about funding
Figure 7: Collection development budgets
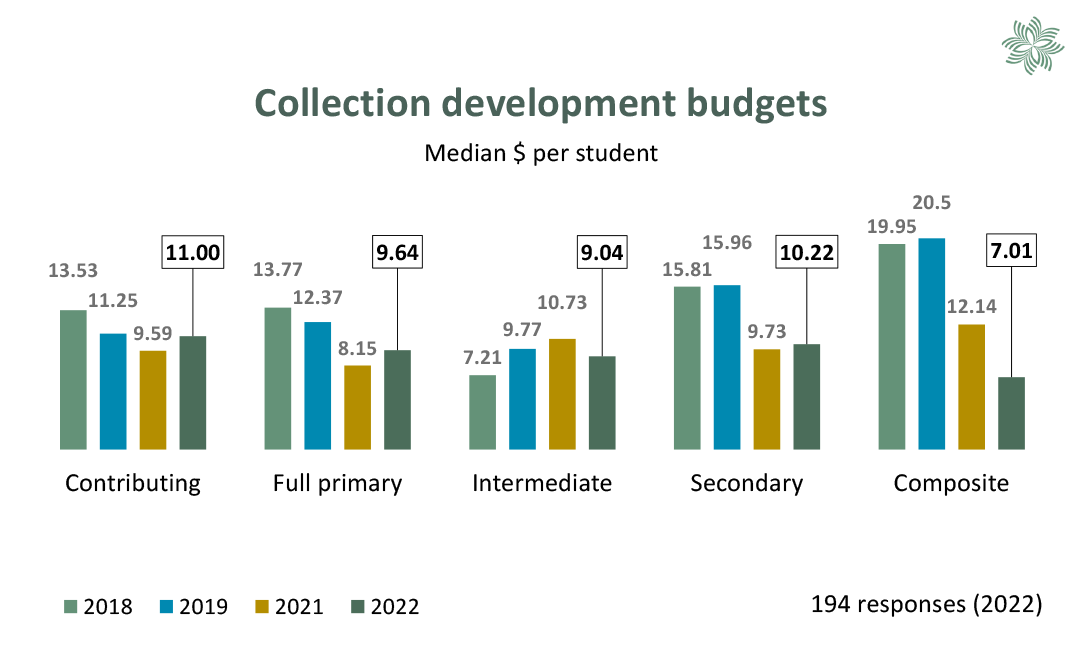
Table 20: Median per-student funding for collection development by year — broken down by school type
School type | 2018 ($ per student) | 2019 ($ per student) | 2021 ($ per student) | 2022 ($ per student) |
|---|---|---|---|---|
Contributing | 13.53 | 11.25 | 9.59 | 11.00 |
Full primary | 13.77 | 12.37 | 8.15 | 9.64 |
Intermediate | 7.21 | 9.77 | 10.73 | 9.04 |
Secondary | 15.81 | 15.96 | 9.73 | 10.22 |
Composite | 19.95 | 20.5 | 12.14 | 7.01 |
Table 21: 2022 collection development budgets compared to 2021
School type | More than 2021 (%) | The same (%) | Less than 2021 (%) |
|---|---|---|---|
Contributing | 19 | 59 | 22 |
Full primary | 16 | 63 | 21 |
Intermediate | n/a | 100 | n/a |
Secondary | 8 | 67 | 25 |
Composite | 27 | 46 | 27 |
Funding sources
Most responding schools receive collection development funding from the school's operational grant. This grant also provides the bulk of their library funding.
For some school libraries, community support (such as fundraising, donations and charitable grants) is an important source of funding.
Table 22: Percentage of responding schools using each funding source
Note that percentages in the table add to more than 100% as respondents could choose more than one option.
Funding source | Responding schools using source (%) |
|---|---|
Operations grant | 72 |
Fundraising | 26 |
Other e.g. donations | 18 |
Board of Trustees funding | 18 |
Grants | 15 |
PTA/parent support | 8 |
No collection development funding | 1 |
Discussion
Similarities and differences across schools
In this report, we’ve aggregated results to show a simple view of the data — for example, average library staff hours and collection budgets. We have also used broad groups, such as school type, to combine data.
There are some clear differences between groups. For example, paid library staff hours at responding primary, intermediate and secondary schools average around 2.5 minutes per student per week (see table 3). To compare, responding composite schools' paid library staff hours average 8.2 minutes per student per week.
Each school makes their own decisions about library funding, and this is evident in individual survey responses. So the survey data shows a wide range from the highest to the lowest values. For example, paid library staff time across all responding schools ranges from 22 minutes to less than 1 minute per week per student.
These differences between and across school types and sizes can impact the range and quality of school library services in various ways, such as:
constraining or enabling library service development and delivery, depending on library staff time
limiting or enhancing collection development, with flow-on effects on students’ reading and learning.
Library staff remuneration
Survey responses were collected in November 2022. At that time, the Librarians and Library Assistants' Pay Equity Claim was in progress. It was the third such claim raised by NZEI with the Ministry of Education. Teacher aide and administration staff pay equity claims were already settled. Those staff had received significant increases in pay rates.
For many library staff, their pay fell behind that of their support staff colleagues. Also, some school library support staff earn less per hour than the living wage (currently $23.65 per hour).
In February 2023, the Librarians and Library Assistants' Pay Equity Claim was settled. The settlement introduces new gradings, pay rates and a work matrix detailing job requirements. The work matrix should ensure a greater understanding of library staff roles.
Better pay rates should have a positive impact on library staff, and contribute to school library work being a financially viable career choice. We expect future survey responses about library staffing and employment to reflect this.
Workforce change
The 2022 data about library staff's future plans continues previous trends, with 25% of respondents either planning to retire or looking for other work. There will be a need for continuing professional development for library staff at all stages of their career.
One impact of pay equity changes may be that some school library staff decide to remain in their positions rather than look for other work.
School library collections
The collection trends shown in previous reports continue. Findings from the 2022 survey show that:
print holdings are the mainstay of school library collections and respondents expect this to continue
there is a shift for non-fiction holdings from print towards digital resources
few school library collections include artefacts and objects, or maker tools and equipment
collection development can be affected by a lack of space, library staff time and funding.
Future research
May 2023 marks 5 years since our first national survey of school libraries. This has been a period of great change for schools, with system review, curriculum updates and the COVID-19 pandemic. Future research could:
explore the impact of the above changes on school libraries and library staff
resurvey schools about the role and importance of school libraries and library staff to gauge how these have changed since our first survey
investigate school library spaces, particularly considering shifts towards innovative learning environments in schools
focus on employment matters, especially the impact of pay equity on school library support staff.
Conclusion and recommendations
It is up to each school and kura to decide what library staffing, funding and other resourcing they need to achieve the goals and aspirations they have for all their learners. This self-governance approach means that there is wide variation between individual schools.
School library staff wages, library collection budgets and other resourcing (such as teacher aide staffing) are generally funded through one source — the Ministry of Education's operational funding. Investment in the school library is therefore part of a complex series of budgeting decisions schools must make. We hope that this report helps guide schools' decisions about their library.
But it is important to remember that the report presents a snapshot of responding schools. As such, the report provides benchmarks for comparison, rather than making recommendations for schools. The report is best used alongside the other school library development resources and support National Library, SLANZA and LIANZA provide.
We recommend that National Library Services to Schools, LIANZA and SLANZA:
share the findings widely, especially with stakeholders in the education and library sectors
use the findings to guide the development of our services that support school libraries and school library staff
encourage further research stemming from the findings of this survey
work together to address concerns raised in this report about school library provision
survey schools again to track changes over time and to deepen our understanding of areas identified for particular focus.